
Chapter 2.2 - Understanding the reality

#NoEstimates
Cycle Time
https://martinfowler.com/bliki/CycleTime.html
DIKW
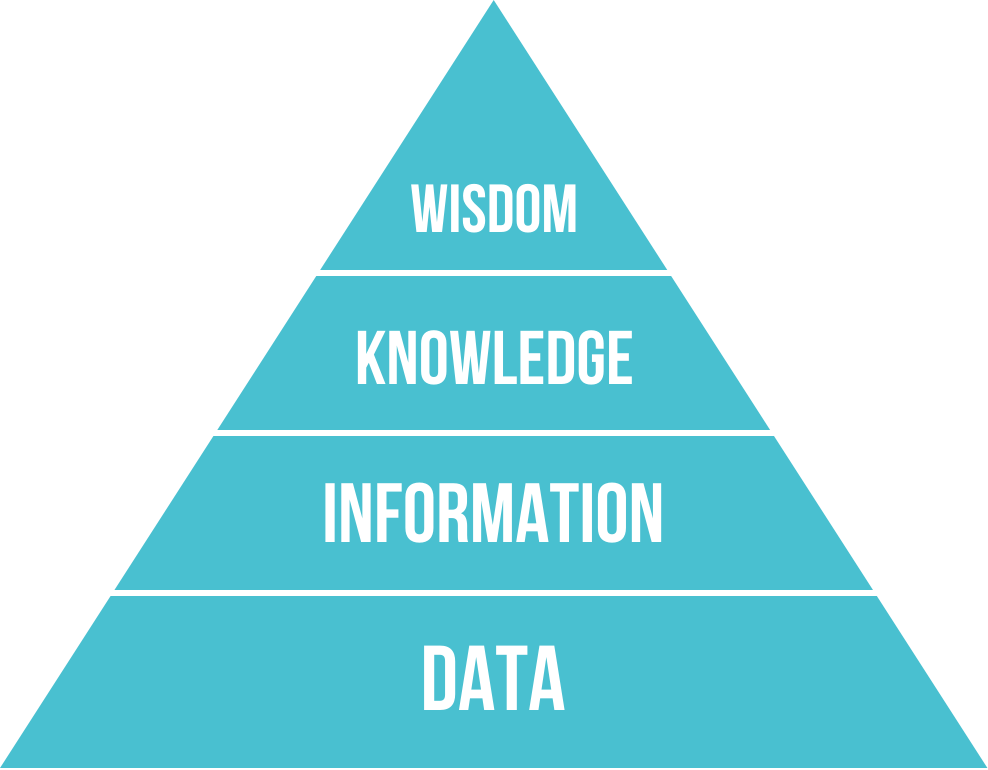
DIKW is a hierarchical model that represents the relationships between Data, Information, Knowledge, and Wisdom. It's often depicted as a pyramid with Data at the bottom, followed by Information, then Knowledge, and finally Wisdom at the top. Each level builds upon and adds value to the levels below it.
At the base, Data consists of raw facts and figures without context (like "72 degrees"). Information is data with context and meaning ("it's 72 degrees Fahrenheit outside today"). Knowledge represents the understanding gained from information and experience ("72 degrees Fahrenheit is a comfortable temperature for most people"). Finally, Wisdom is the ability to apply knowledge effectively, understanding why and how to use it in different situations ("given that it's 72 degrees, it's a good day for outdoor activities, but we should still bring water because extended outdoor activity can cause dehydration even in comfortable temperatures"). The model is widely used in knowledge management, information science, and organizational learning to understand how raw data can be transformed into actionable wisdom through various processes of contextualization, understanding, and application.
Measuring documentation
Idea of labeling pages Counting LoC Using C4model Mermaid.js OpenAPI
Measuring maintainability
https://blog.hello2morrow.com/2018/12/a-promising-new-metric-to-track-maintainability/
Decoupling level: https://www.cs.drexel.edu/~yfcai/papers/2016/icse2016-DL.pdf
DORA
DORA (DevOps Research and Assessment) metrics are key performance indicators that measure software development and delivery performance. These metrics were established through extensive research by the DORA team (now part of Google Cloud) after studying thousands of teams across different organizations. The research identified four critical metrics that correlate with high-performing technology organizations.
The four DORA metrics are: Deployment Frequency (how often an organization successfully releases to production), Lead Time for Changes (how long it takes from code commit to code running in production), Mean Time to Recovery (how long it takes to restore service when an incident occurs), and Change Failure Rate (what percentage of changes result in degraded service or require remediation). These metrics work together to give a balanced view of both speed (deployment frequency and lead time) and stability (time to recovery and change failure rate).
Based on these metrics, organizations can be classified into different performance levels: Elite, High, Medium, and Low performers. Elite performers typically deploy on-demand (multiple times per day), have lead times of less than one hour, can recover from incidents in less than one hour, and have a change failure rate between 0-15%. The metrics provide organizations with benchmarks to measure their performance against industry standards and help identify areas for improvement in their software delivery processes.
The DORA metrics have become increasingly important in the DevOps world as they provide objective, research-backed measures of software delivery performance that correlate with organizational success. They help teams focus on meaningful improvements rather than vanity metrics, and provide a common language for discussing and measuring DevOps performance across the industry. However, it's important to note that these metrics should be used as guidelines rather than strict targets, as context matters and improvement should be measured against an organization's own baseline.
SPACE
The SPACE model, developed by Nicole Forsgren, Jez Humble, and Gene Kim in their book "Accelerate," provides a comprehensive framework for measuring software delivery performance. SPACE stands for:
- Satisfaction and well-being: How happy and engaged are the team members?
- Performance: How efficiently is the team delivering value?
- Activity: What is the team working on, and how much work is being done?
- Communication and collaboration: How effectively is the team working together?
- Efficiency and flow: How smoothly is work moving through the system?
By incorporating the SPACE model, managers can take a holistic approach to performance measurement, ensuring that they are not just focusing on one aspect but considering the entire ecosystem of team dynamics, delivery efficiency, and customer satisfaction. This balanced approach helps in making more informed decisions and driving sustainable success.

DevEx
Abi Noda's work on DevEx (Developer Experience) focuses on measuring and improving developer productivity through a scientific, evidence-based approach. He founded DX (a company focused on DevEx measurement) and has developed frameworks for measuring developer experience based on three core dimensions: Feedback Loops, Cognitive Load, and Flow State.
His measurement approach emphasizes collecting both qualitative and quantitative data about how developers experience their work environment. Rather than focusing solely on output metrics like lines of code or deployment frequency, Noda's framework looks at developers' perceptions and experiences of their work, including how quickly they can get feedback on their code changes, how much mental effort they need to expend to complete tasks, and their ability to maintain focused, productive work states. This is typically measured through structured surveys and feedback collection that helps organizations understand where developers are experiencing friction and what improvements would have the most impact on their productivity and satisfaction.
The core idea is that by measuring and improving these foundational aspects of developer experience, organizations can create better working environments that lead to higher productivity, better code quality, and improved developer retention. This stands in contrast to more traditional productivity metrics that might miss important aspects of how developers actually experience their work.
Goodhart's law
Goodhart's Law, named after economist Charles Goodhart, states:
When a measure becomes a target, it ceases to be a good measure
In other words, when you take a metric that was previously useful for observing a system and start using it as a goal to optimize for, people will find ways to optimize the metric itself rather than the underlying thing you actually care about, often leading to unintended and potentially harmful consequences.
A classic example is when schools focus heavily on standardized test scores. While test scores might initially be a good measure of educational quality, when they become the target, teachers might "teach to the test" rather than focusing on actual learning and understanding. Similarly, in software development, if you measure programmer productivity by lines of code written, developers might write unnecessarily verbose code to hit targets rather than focusing on writing efficient, maintainable solutions. In social media, optimizing for "engagement" metrics led to algorithms that promote controversial and divisive content because it generates more clicks and comments, even though this might be harmful to social discourse. The law highlights the importance of carefully choosing what you measure and being aware that the act of measurement itself can change behavior in ways that undermine the original purpose of the metric.
Google’s Project Aristotle
Project Aristotle was a major research initiative conducted by Google's People Operations department to understand what makes teams effective. Started in 2012, the project analyzed data from hundreds of Google teams to identify the key factors that contribute to team success. Initially, the researchers expected to find that the best teams were simply those that had the most skilled members or similar personalities, but their findings revealed something quite different.
The research concluded that the single most important factor in team effectiveness was psychological safety - the belief that team members won't be punished or humiliated for speaking up with ideas, questions, concerns, or mistakes. Beyond psychological safety, the other key factors identified were dependability, structure and clarity, meaning, and impact. Importantly, the research showed that who is on a team matters less than how team members interact, structure their work, and view their contributions. These findings have had a significant influence on how organizations think about team dynamics and have led many companies to focus more on creating environments where people feel safe to take risks and be vulnerable with their teammates. The project's name was inspired by Aristotle's quote:
The whole is greater than the sum of its parts
This reflects the idea that team dynamics matter more than individual talents in determining success.
Likert Scale
A Likert scale is a psychometric rating scale commonly used in questionnaires and surveys to measure people's attitudes, opinions, or perceptions. Named after its creator, psychologist Rensis Likert, the scale typically consists of a series of statements that respondents rate on a spectrum of agreement, usually with five or seven points ranging from "Strongly Disagree" to "Strongly Agree," though other variations exist.
A typical five-point Likert scale might include the options: Strongly Disagree (1), Disagree (2), Neither Agree nor Disagree (3), Agree (4), and Strongly Agree (5). The scale is particularly useful because it allows for degrees of opinion, rather than simple yes/no answers, and the responses can be easily quantified and analyzed statistically. This makes it valuable for research in psychology, sociology, marketing, and other fields where measuring attitudes and opinions is important. While the traditional Likert scale measures agreement, variations can measure frequency (Never to Always), quality (Poor to Excellent), likelihood (Not at all likely to Extremely likely), or other graduated responses.
Overconfidence effect
The overconfidence effect is a cognitive bias in which people tend to hold an overly favorable view of their abilities, knowledge, or the accuracy of their predictions. They often believe they are more skilled or better informed than they actually are, which can lead to errors in judgment and decision-making. This bias can surface in numerous areas, such as investing, academic pursuits, and workplace performance, causing individuals to underestimate risks and overestimate their level of understanding. By placing excessive trust in their own opinions or capabilities, people affected by the overconfidence effect may neglect to properly evaluate alternative perspectives or thoroughly analyze relevant evidence.
Treat your code as a crime scene
Carving success: How empathy and strategy shape winning engineering teams

Much like a skilled carpenter who selects, studies, and shapes wood into a beautiful piece of furniture, an effective engineering manager must recognize that the most vital material in their craft is people 🙋. While tools and technologies often capture our attention, the true cornerstone of success lies in the well-be…
Tidy Data
In the world of data analysis, having a consistent way to organize your data can save you a lot of time and effort. This is where the concept of tidy data comes in. Tidy data follows three simple rules: each variable must have its own column, each observation must have its own row, and each value must have its own cell. This structure makes it easier to manipulate and analyze data using tools from the tidyverse, a collection of R packages designed for data science.
Have a look at this article from Hadley Wickham.